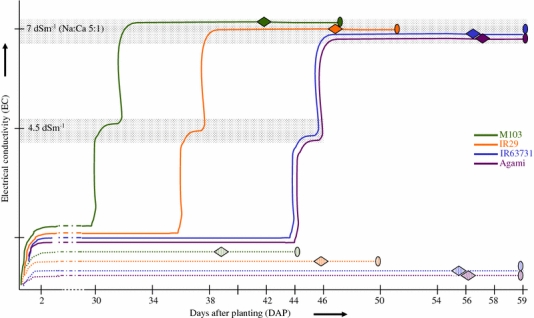
Fig. 1.

Experimental design of salinity stress treatment. Salinity stress was applied 9–10 days before panicle initiation (PI). A final salinity level of 7 dS m−1 was reached by a two-step addition of NaCl and CaCl2. Conductivity in the control tanks is represented by a dotted line and the treated tank by a solid line. Diamonds represent the PI and ovals represent the harvest time points. The crown and growing point of the main shoot were harvested 4–5 days after reaching PI
