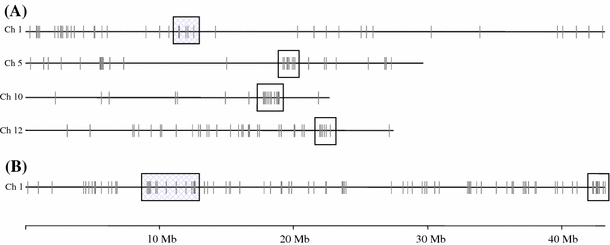
Fig. 3.

Rice chromosomes with gene clusters based on genotypic comparisons. (A) Rice gene model clusters on chromosomes 1, 5, 10 and 12 obtained from genotypic comparison of M103 with Agami under control conditions. (B) Rice gene model clusters on chromosome 1, obtained by genotypic comparison of IR29 with IR63731 using unstressed samples. The chromosome displays only up-regulated rice genes in the tolerant lines under control conditions. The gene clusters with shaded area co-localize to previously identified as a salt tolerance QTL on chromosome 1
