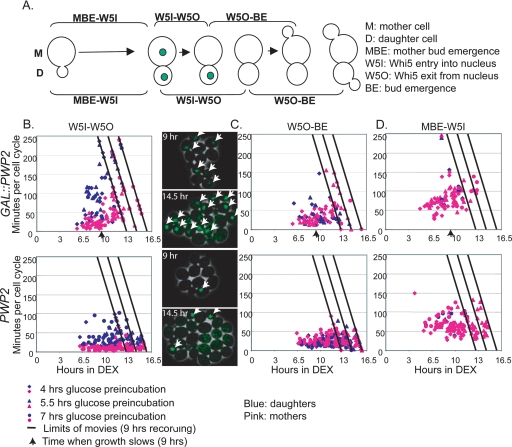
Figure 6.
Increased nuclear residence time of Whi5 when ribosome biogenesis is disrupted. Using time-lapse microscopy, individual mother and daughter Whi5-GFP cells were analyzed in GAL::PWP2 and PWP2 yeast from a series of three movies representing different preincubation times in dextrose (either 4, 5.5, or 7 h). Data from all three movies were plotted on the same graph. The number of total hours in dextrose (Pwp2 depletion) is plotted on the x-axis and individual cell cycle interval is plotted on the y-axis in minutes. The time limit for each movie is shown with a diagonal line representing the maximum time for an event that could be observed. Uncompleted events, represented as symbols on the diagonal line, are assigned to the movie limit line. Individual mother cells are represented in pink, and daughter cells are blue. (A) Cell cycle analysis of individual Whi5-GFP yeast can be divided into three parts: 1) Mother bud emergence to Whi5 nuclear entry (MBE-W5I), 2) Whi5 nuclear entry to exit (W5I-W5O), and 3) Whi5 nuclear exit to bud emergence (W5O-BE). (B) Graph of time interval indicating Whi5 nuclear residence (W5I-W5O) in GAL::PWP2 and PWP2 yeast, as a function of time after transfer to dextrose that Whi5 nuclear entry occurred. Still frame examples of yeast depleted or not of Pwp2 (9 and 14.5 h dextrose) with nuclear Whi5-GFP foci marked with white arrows are from the 5.5 h dextrose preincubation movie. (C) Graph of time interval indicating Whi5 nuclear exit to bud emergence (W5O-BE) in GAL::PWP2 and PWP2 yeast, as a function of time after transfer to dextrose that Whi5 nuclear exit occurred. (D) Graph of the time interval indicating mother bud emergence to Whi5 nuclear entry (MBE-W5I) in GAL::PWP2 and PWP2, as a function of time after transfer to dextrose that mother bud emergence occurred.

