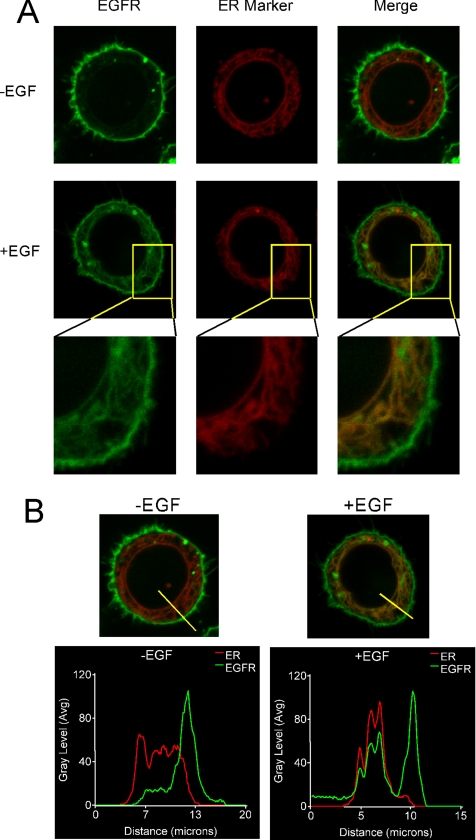
Figure 2.
EGF-induced EGFR-mGFP translocation to ER. (A) MDA-MB-468 cells were transiently cotransfected with cDNAs encoding the ER protein calreticulin and EGFR fused, respectively, with RFP or mGFP. The cells were then treated with EGF for 0 or 6 h. Live-cell images were taken by confocal microscopy with a 1–1.5-μm optical slice. (B) The merged images from A are repeated with line intensity scan using Metamorph software to assess of colocalization of these two markers. A 20-μm-wide yellow line was drawn as indicated in control and EGF-treated cells. Intensity profiles corresponding to the yellow lines were determined using Metamorph software. Y- and X-axes represent the level of fluorescence and scanning position, respectively.

