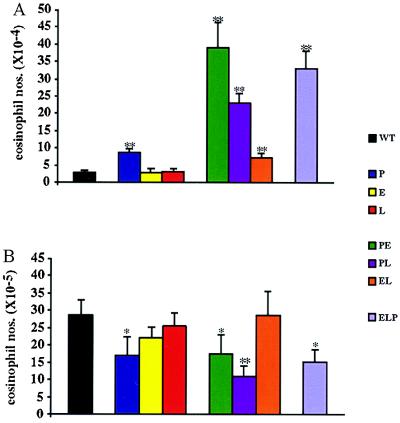
Figure 6.
Eosinophil influx after ragweed sensitization and challenge. (A) Peripheral eosinophil counts. Blood was collected by using Eosinophil Unopettes for Manual Methods and eosinophils were counted by using a hemocytometer. (B) Peritoneal eosinophil counts after ragweed challenge. Ragweed-sensitized mice were challenged with an i.p. injection of ragweed allergen. Forty-eight hours later, peritoneal lavages were performed. Total cell numbers were determined with a hemocytometer and the percentages of eosinophils were determined from cytospun, Diff-Quick-stained samples. n = 12–23. ∗, P < 0.05; ∗∗, P < 0.01, in comparison to WT mice. All strains showing decreased levels relative to WT mice were statistically indistinguishable from each other.

