Figure 2.

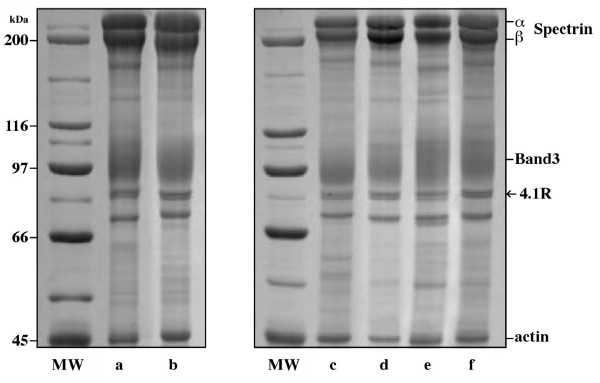
Electrophoretic analyses (SDS-PAGE) of erythrocyte membrane proteins from patients (a = IV:6 RM13; c = IV:1 RM16; d = IV:3 RM15; e = IV:1 RM23) and controls (b, f). MW = molecular weight standards.

Electrophoretic analyses (SDS-PAGE) of erythrocyte membrane proteins from patients (a = IV:6 RM13; c = IV:1 RM16; d = IV:3 RM15; e = IV:1 RM23) and controls (b, f). MW = molecular weight standards.