
Fig. 1.
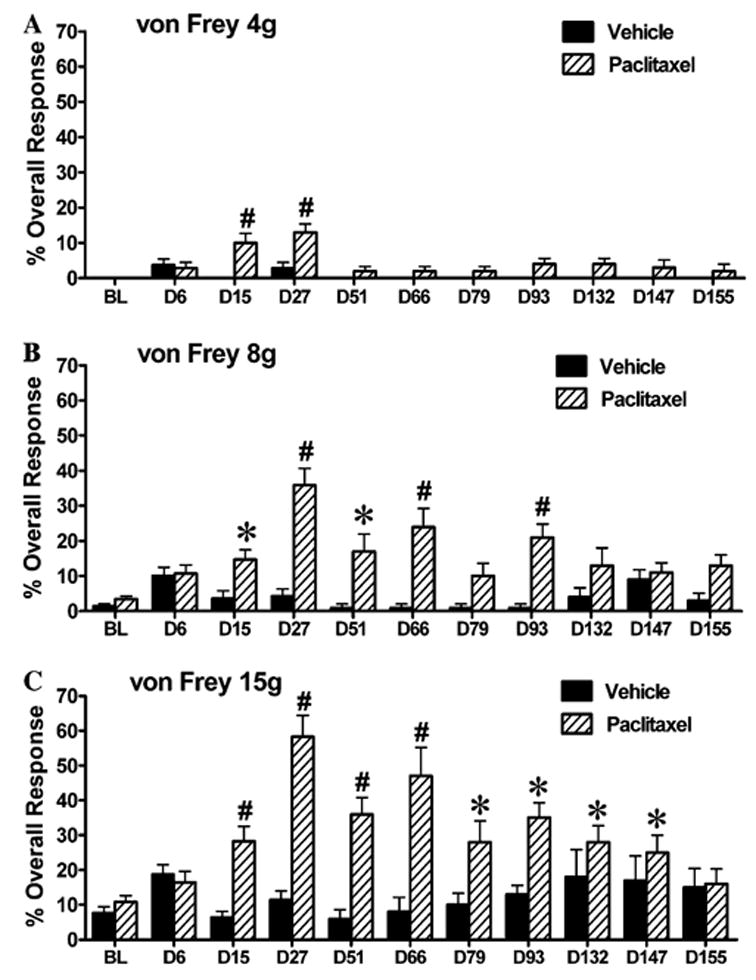
Behavioural time-course of mechano-allodynia and mechano-hyperalgesia induced by paclitaxel treatment. Graph shows the mean ± SEM of the response frequency to mechanical stimulation by (A) von Frey 4 g, (B) von Frey 8 g and (C) von Frey 15 g. n = 8–14 for vehicle treatment, n = 10–17 for paclitaxel treatment. *p < 0.05, #p < 0.01, one-way repeated-measures ANOVA with Dunnett’s post hoc analysis compared to baseline (BL).