
Fig. 7.
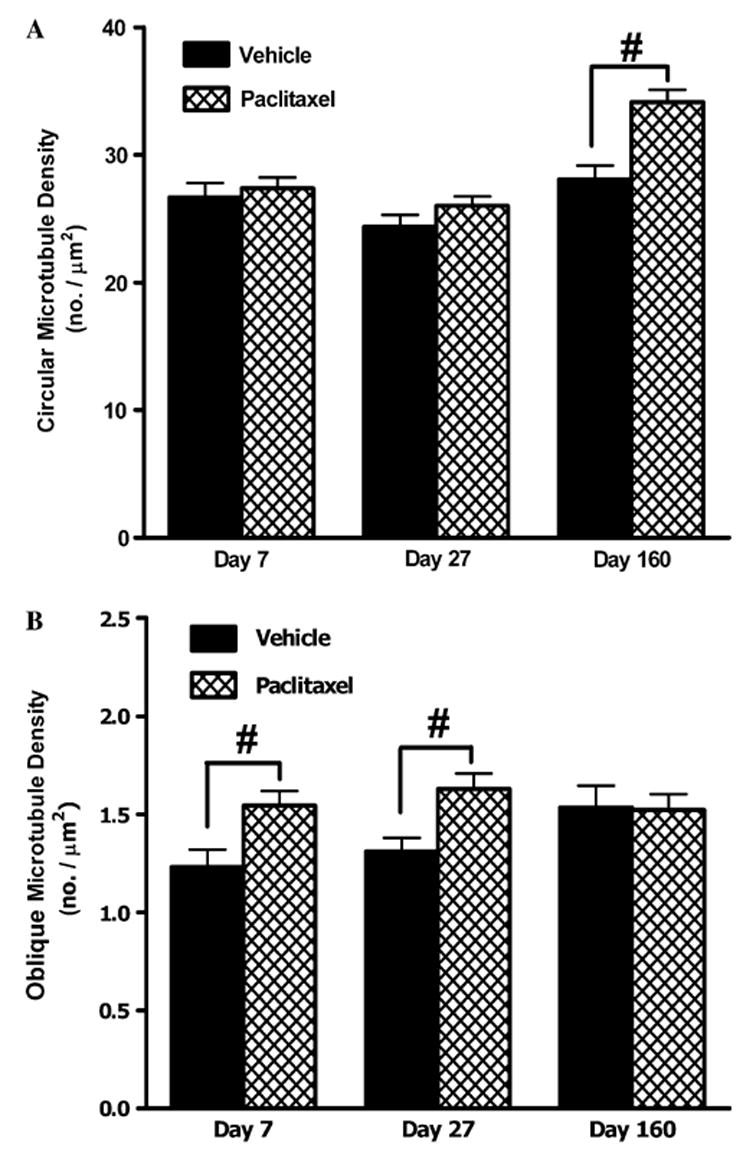
Effect of paclitaxel on circular and oblique microtubule populations in myelinated axons. Graphs show the mean ± SEM of the density of (A) circular microtubule profiles and (B) oblique microtubule profiles in myelinated axons of vehicle-treated and paclitaxel-treated nerves at days 7, 27 and 160 post-initiation of treatment. At each time point, circular and oblique microtubules were counted in 120 myelinated axons randomly sampled from two vehicle-treated rats and 180 myelinated axons randomly sampled from three paclitaxel-treated rats. Vehicle n = 120, paclitaxel n = 180: #p < 0.01, two-tailed unpaired t-tests, Welch correction applied as appropriate. Note: marked 16-fold change in y-axis range in (B) compared to (A).