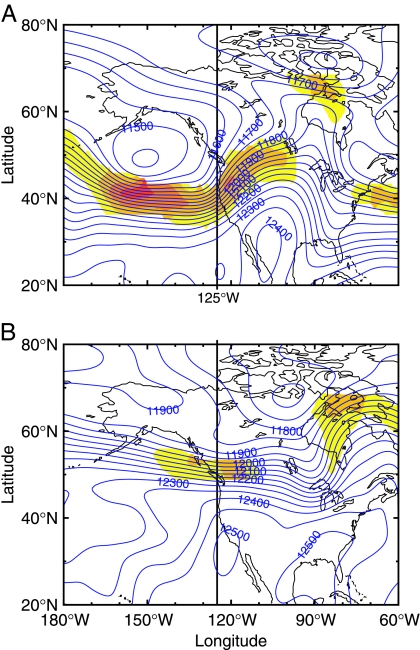
Fig. 2.
Maps of 200-hPa surface height (m, blue contours) and wind speed at 300 hPa (m·s−1, color shading), from six hourly National Centers for Environmental Prediction reanalyses (25) when the jet stream is located anomalously south (May 20, 2005, 1200 Coordinated Universal Time; A) and in its more typical summer position (July 19, 2005, 0000 Coordinated Universal Time; B). Wind speeds >35 m·s−1 are shown, with color increments at 45, 55, and 65 m·s−1.

