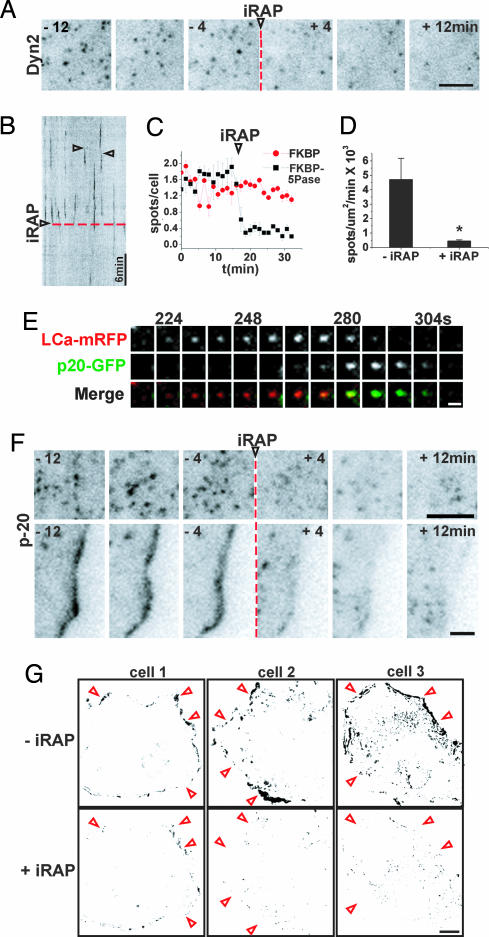
Fig. 5.
Effect of PI(4,5)P2 depletion on dynamin and Arp2/3. (A and B) Select frames and kymograph from a TIRFM time series of a COS-7 cell expressing Dyn2-GFP and mRFP-FKBP-5Pase (channel not shown). (A–C and F) An arrowhead and a red dashed line mark iRAP delivery. (B) Examples of dynamic Dyn2-GFP spots are indicated by open arrowheads. (C) Number of Dyn2-GFP spots over time, before and after iRAP delivery, normalized and averaged from three cells expressing mRFP-FKBP (red) or mRFP-FKBP-5Pase (black). (D) Number of newly formed Dyn2-GFP spots per μm2/min before and after iRAP. Values are averages from three cells; P = 0.041 (Student's t test). (E) Select frames from a time series of a single CCP containing LCa-mRFP and p20-GFP. Recruitment of Arp2/3 (p20-GFP fluorescence) occurs at a late stage in CCP formation. (F) Select frames from a series of a p20-GFP-expressing cell showing iRAP-induced disappearance of p20-GFP fluorescence both from spots at the ventral surface of the cell (Upper) and from a lamellipodium (Lower). (G) Analysis of motility in three cells expressing actin-GFP and mRFP-FKBP-5Pase (data not shown) and imaged for 10 min before (Upper) and after (Lower) iRAP delivery. Darker pixels indicate areas of higher motility (see Methods). The profiles of the cells are roughly indicated by red arrowheads. [Scale bars, 10 μm (G); 5 μm (A and F); 1 μm (E).]

