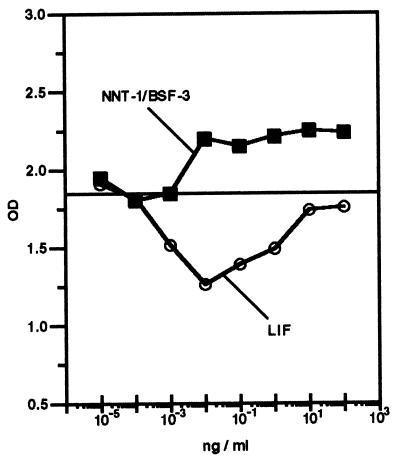
Figure 6.
Growth of M1 murine myeloid leukemia cell exposed in culture for 7 days to a concentration range of NNT-1/BSF-3 or LIF. The horizontal line indicates the growth of M1 cells exposed to NNT-1/BSF-3 buffer as a control. OD values given by NNT-1/BSF-3 concentrations above 10−3 ng/ml were higher than those given by NNT-1/BSF-3 buffer (P < 0.001), whereas OD values given by LIF concentrations ranging between 10−3 and 1 ng/ml were lower (P < 0.001; n = 5). This experiment was done four times with similar results.

