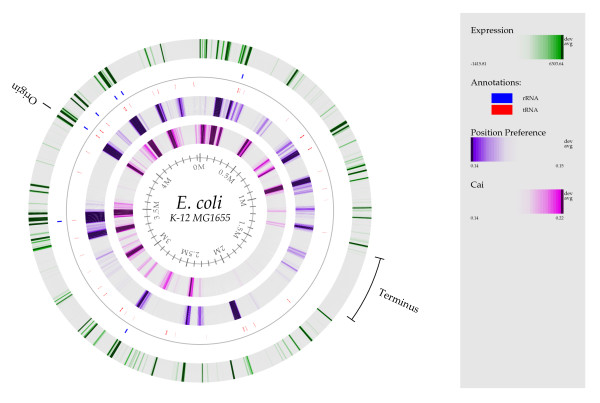
Figure 1.
Atlas illustration of the E. coli genome. The atlas illustrates CAI values, position preference values and microarray gene expression values for E. coli. The average position preference values and gene expression values are illustrated for all genes at their genomic position. The CAI values can only be calculated for protein encoding genes and are therefore only illustrated for these. The range of all three color scales corresponds to ± 1.5 standard deviations.

