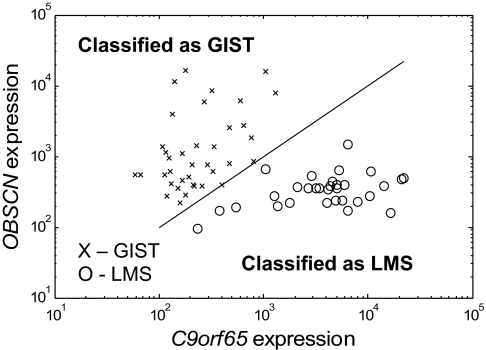
Fig. 2.
Expression values of the two genes involved in the TSP classifier on the Agilent microarrays after quantile normalization. (Note: The classification is independent of normalization, because the decision is based only on which gene is higher, but the magnitude of the expression shown does vary somewhat with normalization technique.) The separating line (slope = 1) represents the cutoff for which gene is more highly expressed. It is not a fit to the data.

