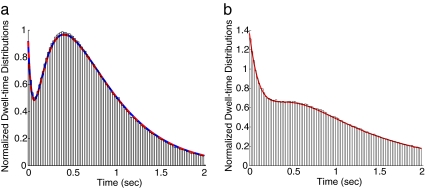
Fig. 3.
Agreement of dwell-time distributions results from the EAB method and other methods. (a) The results from the EAB method (red line), the analytical solution (blue dashed line) and the histogram obtained from the Monte Carlo simulation for Scheme 1. The curves from the EAB method and the analytical solution overlap almost perfectly. (b) The results from the EAB method and the histogram from the Monte Carlo simulation for Scheme 10.

