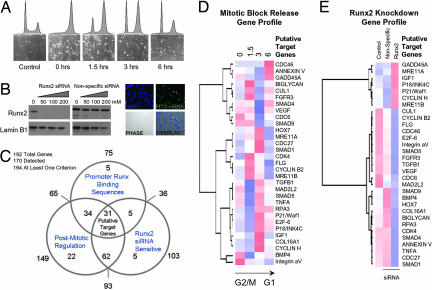
Fig. 2.
Runx2 target gene identification. To identify mitotic target genes of Runx2, we applied a functional genomics strategy. Genes were selected that exhibit alterations in steady-state mRNA during progress from mitosis into G1, that are sensitive to Runx2 siRNA, and that have promoters with Runx consensus motifs. The first two criteria were assessed by cDNA array-based gene profiling (SuperArray Bioscience Corporation), and the final criterion was assessed through a bioinformatics analysis by using TFSEARCH (48). (A) Mitotic cells were released into G1, and RNA was taken at 0, 1.5, 3, and 6 h for analysis. (B) siRNA knockdown of Runx2 was monitored by Western blot analysis at concentrations of 50, 100, and 200 nM. Fluorophore-conjugated siRNA oligonucleotides were transfected in parallel to determine transfection efficiency. Micrographs show localization of siRNA oligonucleotides in cells with ≈95% efficiency at 100 nM. (C) Venn diagram indicates the number of genes in each of the three functional groups. Thirty-one target genes satisfying all three criteria were analyzed by hierarchical clustering based on cell cycle expression data (D) and expression in the Runx2-knockdown experiment (E) (see SI Data Set 1 for primer information). Color maps are applied to standardized gene expression data: pure blue, −3; pure white, 0; and pure red, 3.

