Fig. 4.
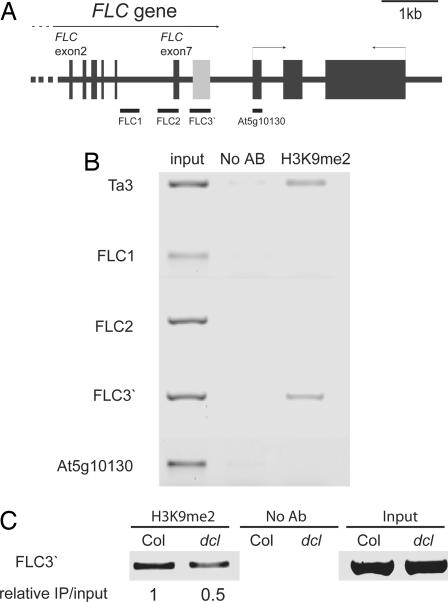
Enrichment of H3K9me2 in the 3′ region of FLC. (A) Schematic representation of FLC and the downstream gene At5g10130. Exons are shown as thick black bars, and introns are represented by black lines joining the exons. The gray rectangle represents the FLC 3′ region described in the paper. Regions amplified by PCR are shown below as bars. (B) Semiquantitative PCR amplification of DNA immunoprecipitated by using an antibody specific for H3K9me2. Ta3 transposon amplification is shown as a positive control. Each ChIP was repeated twice, and the data shown are a representative picture. (C) ChIP analysis of H3K9me2 in the FLC 3′ region in Columbia (Col) and the triple dcl2, 3, 4 mutant (dcl).

