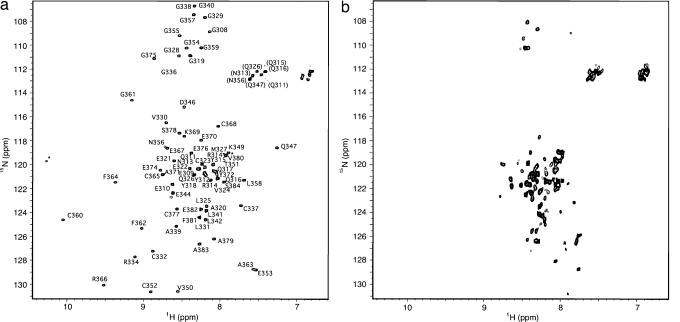
Fig. 1.
Shown are 600 MHz 1H-15N HSQC spectra of Parkin IBR307–384. (a) Folded 0.2 mM IBR307–384 in 25 mM phosphate buffer (pH 6.95), 100 mM NaCl, 1 mM DTT at 25°C. (b) Spectrum of IBR307–384 from a upon EDTA addition showing the protein becomes unfolded. Peaks resulting from the leader sequence, an artifact of the cloning process, are indicated by an asterisk.

