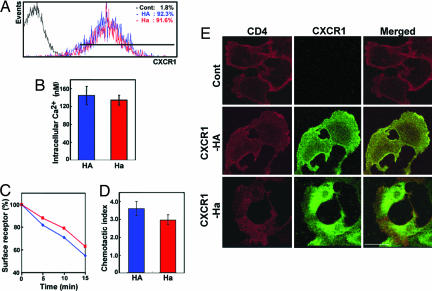
Fig. 3.
CXCR1 expression and cellular responses to its cognate ligand IL-8 by using HOS cells. (A) Flow cytometric analysis of CXCR1 expression. (B) Intracellular Ca2+ mobilization. (C) Receptor internalization. (D) Chemotactic activity. (E) Confocal fluorescence microscopic images showing the subcellular distribution of CD4 (left column, green) and CXCR1-HA or CXCR1-Ha (middle column, red) on each transfected HOS cells. Overlaid green and red images show the colocalization between CD4 and CXCR1 (right column, yellow).

