
Figure 4.
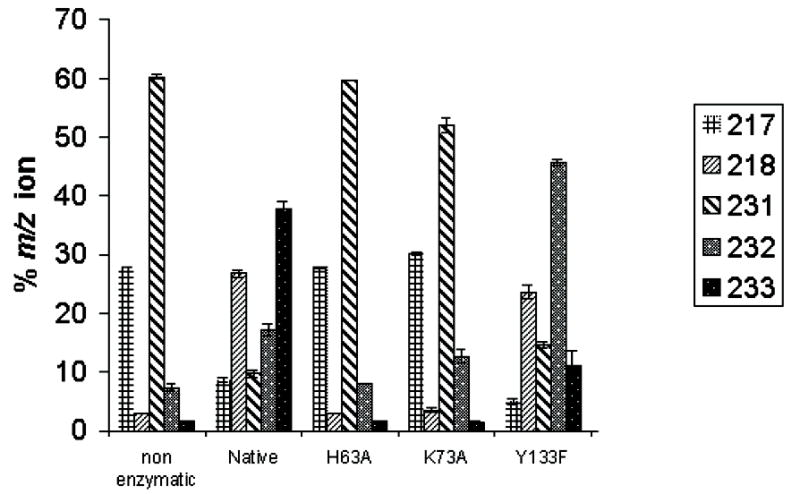
(a) Deuterium incorporation data for mutants of S. enterica serovar Typhimurium RmlC. The masses reflect the fragments of alditol per-acetates associated with deuterium incorporation into substrate. Cleavage between C3′ and C4′ with retention of charge at C3′ yielded an ion at m/z 217 (no deuterium incorporation) or m/z 218 (deuterium incorporation at C3′). Cleavage between C2′ and C3′ with retention of charge at C-3 yielded an ion at m/z 231 (no deuterium incorporation), m/z 232 (deuterium at C3′ or C5′) and m/z 233 (deuterium at C3′ and C5′). Starting material (no D incorporation) has two peaks at 217/231. D incorporation at C5′ only has peaks at 217 and 232. D incorporation at C3′ has two peaks at 218 and 232. D incorporation at both C3′ and C5′ has peaks at 218 and 233. Only the Y133F mutant shows any specific C3′ incorporation. The H63A shows no incorporation, whilst K79A shows some incorporation at C5′ but none at C3′. Y133F mutant shows some C3′ incorporation but no C5′ incorporation.
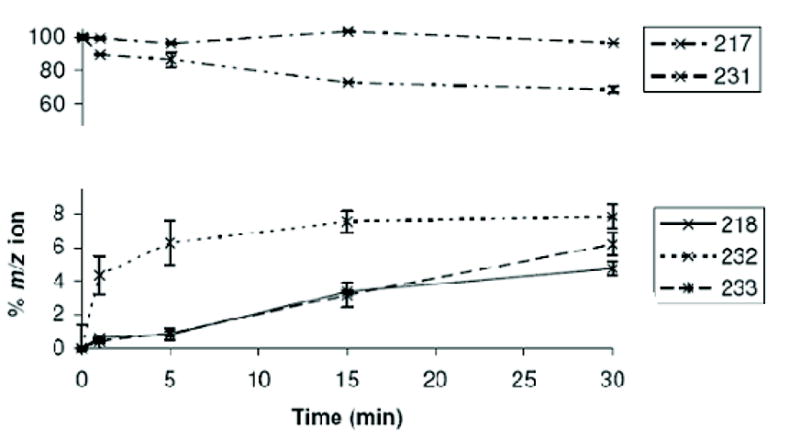
(b) A time course at 10°C measuring C3′ and C5′ deuterium incorporation into substrate, showing loss of signals from non-deuterated substrate (217, 231) and the evolution of deuterium incorporation. The C5′-specific peak at 232 is rapidly established and complete within 10 minutes, the same time frame as loss of the substrate 231 peak. The 218 peak appears more slowly and at approximately the same rate as the 233 peak. This suggests that there is no significant amount of specific C3′ incorporation on its own, rather that C3′ incorporation occurs (within error) after C5′ incorporation.