
Fig. 7.
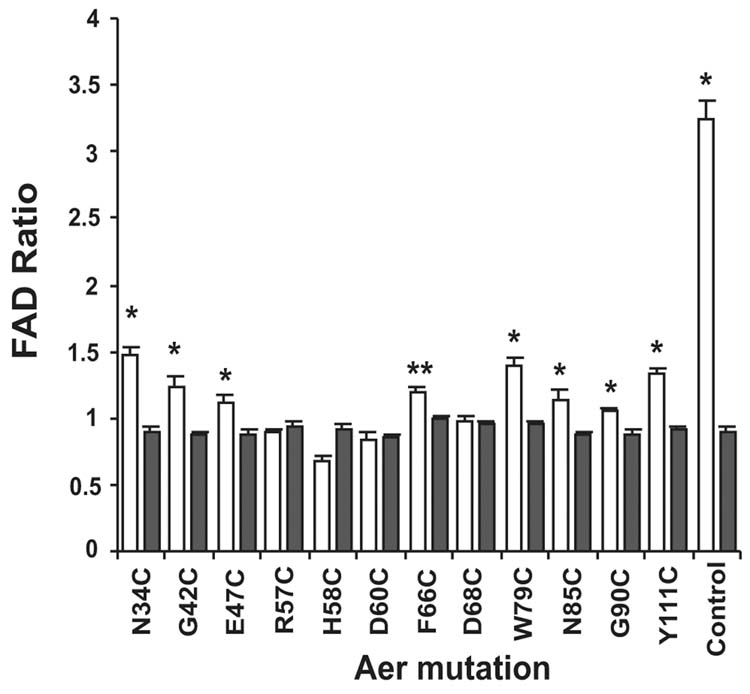
FAD binding by Aer mutants. Histograms represent the increase in membrane FAD when mutant Aer proteins are overexpressed. BT3312 (aer tsr) cells, transformed with a plasmid that encoded a mutant Aer protein, were grown and divided into two flasks. Aer overexpression was induced in one flask by 0.6 mM IPTG. The ratio of total membrane FAD in the induced and uninduced cells was determined (Experimental procedures).
 , Aer alleles;
 , negative control (BT3312 pProEX). Positive control, BT3352 (aer+). Each transformant was analyzed in duplicate on three separate days. The results were analyzed by one-way analysis of variance that compared the relative increase in FAD in each mutant strain to the FAD ratio in the negative control. *, significant increase in FAD (p < 0.01); **, significant increase in FAD (p< 0.05).