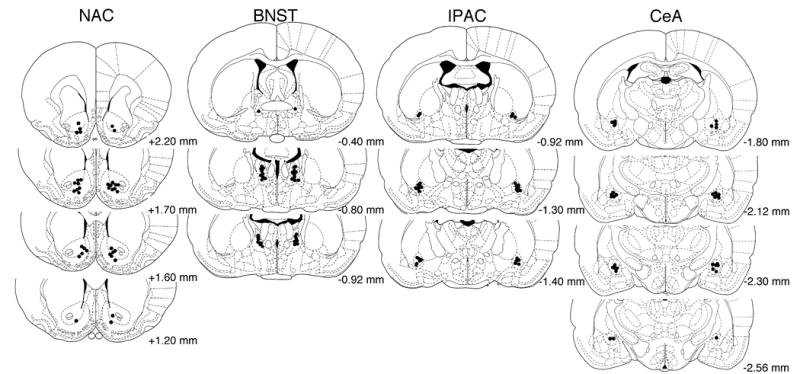
Fig. 1.

Cannula tip placements for the two highest doses tested under Single Morphine (left side) and Repeat Morphine (right side) conditions within each brain region examined. Values represent AP distance from bregma (mm) according to the atlas of Paxinos and Watson (1998). To maintain clarity of individual tip placements, cannula locations for other doses are not shown, but the range of tip placements illustrated is representative of all dose groups.
