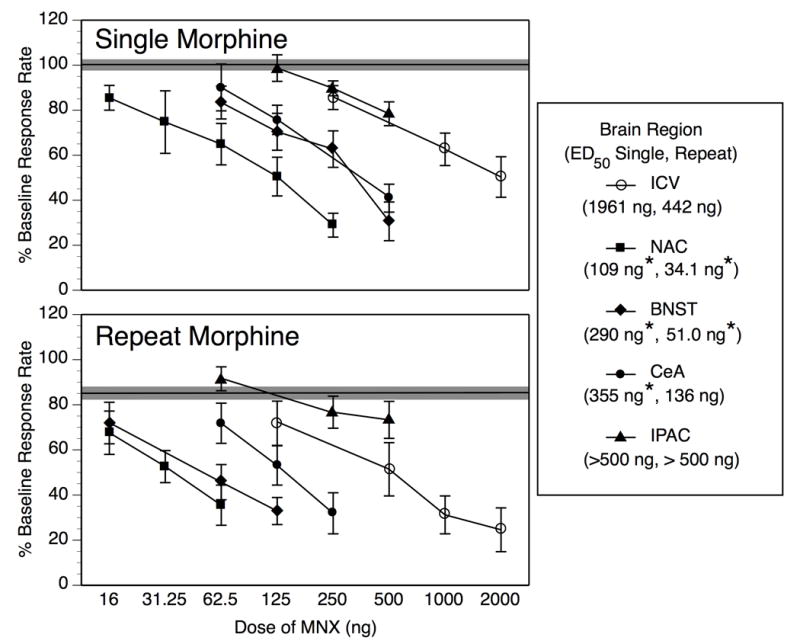
Fig. 3.

This Figure re-presents the data from Fig. 2 in a way that facilitates comparison of MNX dose-effect functions across injection sites. Following a Single Morphine treatment (upper panel), MNX potency is significantly greater in the nucleus accumbens (NAC), bed nucleus of the stria terminalis (BNST), and central amygdala (CeA) than it is following intracerebroventricular infusion (ICV), but MNX potency in the interstitial nucleus of the posterior limb of the anterior commissure (IPAC) does not differ from ICV infusion. With Repeat Morphine treatment (lower panel), MNX remains significantly more potent in the NAC and BNST than following ICV infusion, but its potency in the CeA in addition to the IPAC is not significantly different from its ICV potency. Individual data points on the MNX dose-effect functions represent mean ± SEM percent of baseline response rate. The solid horizontal line represents the composite mean of all 5 injection site groups infused with vehicle 4 hr after Single or Repeat Morphine, and the shaded region around each horizontal line represents ± 1 SEM. Values in parentheses within the legend reflect the ED50 value following Single and Repeat Morphine for that given brain region. *Significant shift in MNX potency relative to ICV treatment under same morphine treatment condition as determined by potency ratio analysis (see Table 2 for full results of this analysis).
