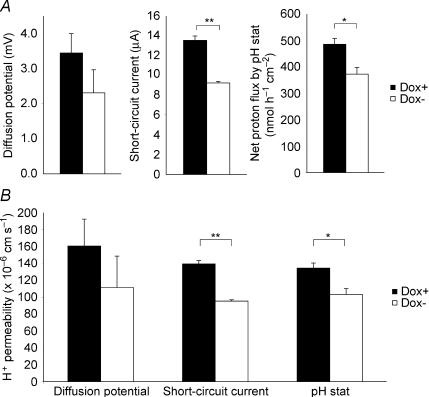
Figure 2. Determination of passive, transepithelial H+ permeability by three independent methods.
A, HCl diffusion potential, short-circuit current, and pH stat-titrated net proton flux measured after imposing a 104-fold transepithelial H+ gradient, in claudin-8-induced (Dox−) and uninduced (Dox+) MDCK II cells. B, comparison of the H+ permeability determined by the three methods. Columns in A and B represent mean ±s.e.m. (n = 3). *P < 0.05; **P < 0.00005.

