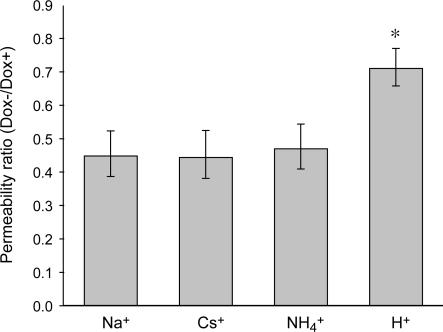
Figure 7. Effect of claudin-8 induction on permeabilities to various cations.
Comparison of the effect of claudin-8 induction on permeabilities to various cations, expressed as the ratio of the mean permeability in Dox− (induced) cells to the mean permeability in Dox+ (control) cells. Error bars represent 95% confidence intervals. *P < 0.05 versus Na+, Cs+ and NH4+. Data are representative of three independent experiments.

