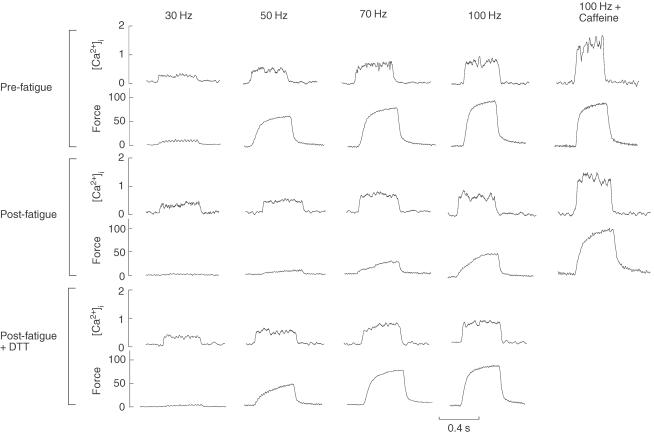
Figure 2. Tetanic [Ca2+]i and force records from various stages of the experiment.
Data from one experiment showing the tetanic [Ca2+]i (μm) and force (% initial) records for the series of tetani required to determine Fmax and Ca50. Upper group from before fatigue; middle group from after fatigue; lower group after 2 min application of DTT (0.5 mm) to the fatigued muscle. Note that in this experiment the post-fatigue + DTT 100 Hz + caff tetanus was unsuccessful and is not shown.

