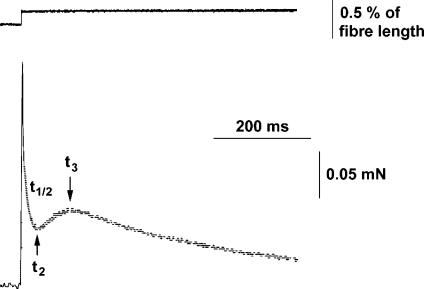
Figure 3. Typical original recordings of length (upper panel) and force (lower panel) in a stretch experiment on a maximally Ca2+-activated rabbit type IIA fibre.
The following kinetic parameters were determined in order to characterize the time course of stretch induced force transient: t2, which is the time from beginning of stretch to the lowest force before the onset of delayed force increase; t½, which is the half-time of the force decay starting 3 ms after beginning of the stretch and ending at t2; and t3, which is the time from the beginning of the stretch to the peak of the delayed force increase.

