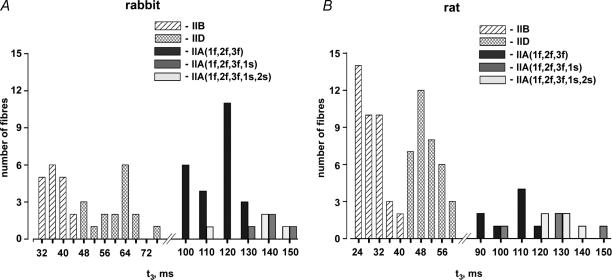
Figure 5. Histogram showing the distribution of the kinetics parameter t3 in fast fibre types of rabbit (A) and rat (B).
The type IIA fibres are classified according to their MLC isoform complement given in brackets. The characters 1f, 2f, 3f, 1s and 2s refer to MLC1f, MLC2f, MLC3f, MLC1s and MLC2s, respectively. Kolmogorov-Smirnov tests (P > 0.1) suggest that the data are normally distributed.

