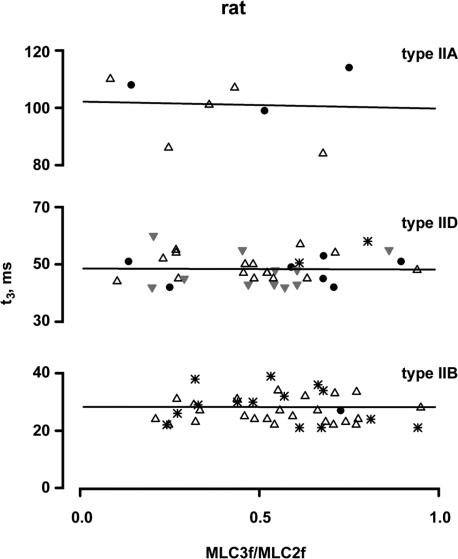
Figure 7. Relationships between t3 and the MLC3f/MLC2f ratio in rat fast fibre types.
All fibres contained only the fast MLC isoforms. The molar ratio of MLC3f/MLC2f serves as a measure for the relative concentrations of MLC1f and MLC3f. Each point represents the mean t3 value of an individual fibre. Different symbols indicate the muscle origin (•, gastrocnemius; ▵, vastus lateralis,  , plantaris; *, tibialis anterior). The straight lines represent the best fits by linear regression analysis to the data points of all fibres of the same type; the slopes of all fitted lines did not significantly deviate from zero (type IIB: P = 0.86, r2 = 0.06; type IID P = 0.93, r2 = 0.0002; type IIA: P = 0.88, r2 = 0.004). The same was true for the regression lines of individual muscles (vastus lateralis type IIB fibres, P = 0.76, r2 = 0.004; tibialis anterior type IIB fibres, P = 0.44, r2 = 0.05; vastus lateralis type IID fibres, P = 0.91, r2 = 0.001; gastrocnemius type IID fibres, P = 0.78, r2 = 0.02; plantaris type IID fibres, P = 0.99, r2 = 0.000002).

