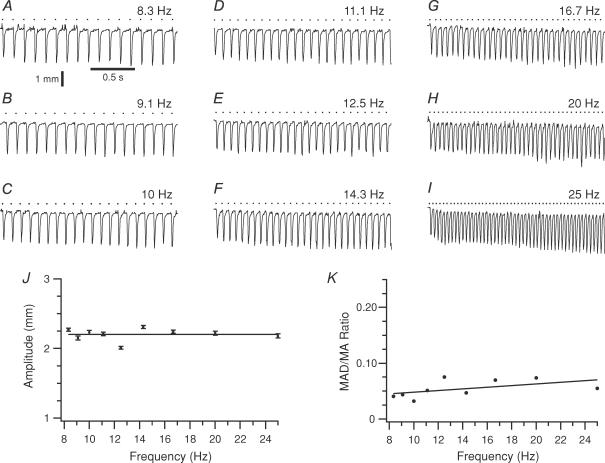
Figure 6. Movements evoked by facial nerve stimulation do not display an ∼10 Hz amplitude modulation.
A–I, movement trajectories of a whisker during facial nerve stimulation at frequencies from 8.3 to 25 Hz. Downward deflections indicate protractions. Calibration bars in A are for A–I. J, plot of average movement amplitude as a function of stimulus frequency. The regression line slope (8.4 × 10⁻⁵± 5.8 × 10⁻³ mm Hz−1) was statistically indistinguishable from zero. Error bars indicate s.e.m.K, plot of MAD/MA ratio for successive movements as a function of stimulus frequency.

