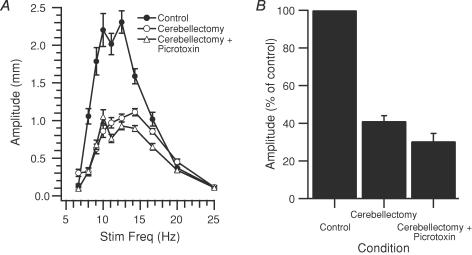
Figure 9. Acute cerebellectomy reduces frequency dependence of movement amplitude.
A, plot of average movement amplitude for one whisker as a function of stimulation frequency. MCtx-evoked movements were measured before (Control, •) and after cerebellectomy (Cerebellectomy, ○), and after cerebellectomy and the injection of picrotoxin into the IO (Cerebellectomy + Picrotoxin, ▵). B, amplitude of movements evoked at peak of frequency response curve in each condition. Movement amplitudes for each whisker in each condition expressed as a percentage of the control condition value. Columns are the averages of 12 whiskers. Error bars indicate s.e.m.

