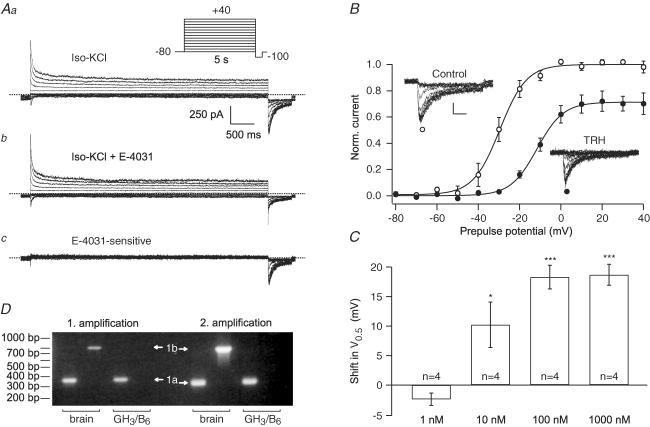
Figure 1. Modulation of GH3/B6 cell erg currents by TRH.
Membrane currents were recorded in native GH3/B6 cells in the perforated-patch whole-cell configuration using isotonic KCl as external solution. From a holding potential of −80 mV, erg current activation was measured with 5 s depolarizing pulses to potentials between −80 and +40 mV followed by a constant hyperpolarizing pulse to −100 mV. The erg currents (Ac) were isolated as difference between the current traces recorded before (Aa) and after application of 10 μm E-4031 (Ab). B, mean normalized maximal erg current amplitudes elicited at repolarization to −100 mV as a function of the preceding test pulse potential before (○) and after (•) the application of 100 nm TRH. Data points were fitted with Boltzmann equations yielding the potentials of half-maximal activation (V0.5). Scale bars, valid for current traces in both insets, denote 100 pA and 100 ms. C, shift in V0.5 values of erg currents induced by the application of different concentrations of TRH. Number of experiments indicated, error bars denote s.e.m.;* and *** denote significant differences before and after TRH with P ≤ 0.05 and P ≤ 0.001, respectively; one-tailed paired t test. D, GH3/B6 cells express transcripts for rat erg1a, but not for erg1b. RT-PCR amplification products from the first and second round of amplification are shown. 20% (1 amplification, left side) or 10% (2 amplification, right side) of the PCR products were separated on a 1.5% agarose gel. Tissue origin of cDNAs used in the PCR reactions: rat brain (lanes 1, 2, 5, 6), GH3/B6 cells (lanes 3, 4, 7, 8). Amplification products of rat erg1a (1a) or rat erg1b (1b) are marked by arrows.

