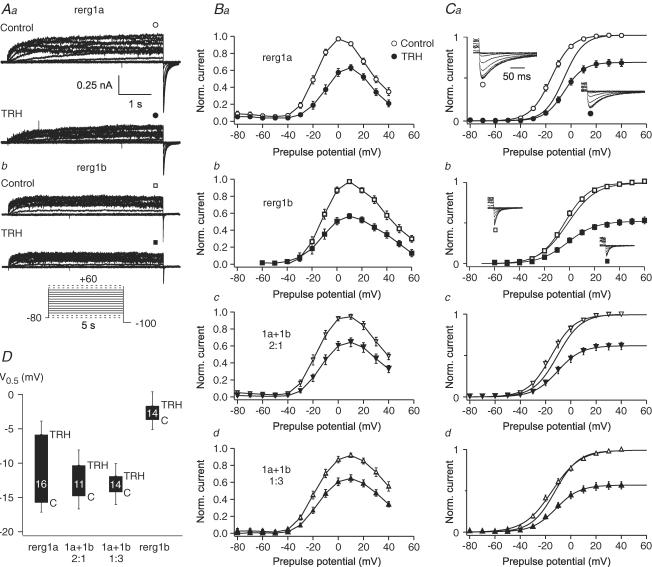
Figure 3. Rerg1b inhibits the TRH-induced shift in rerg1 activation curves.
Membrane currents were recorded in the perforated-patch whole-cell configuration in GH3/B6 cells previously injected with erg cDNA before and after application of 1 μm TRH. Data from cells previously injected with erg cDNA coding for rerg1a (a), rerg1b (b) and rerg1a + rerg1b in the ratios 2: 1 (c) and 1: 3 (d). Erg currents were isolated as E-4031-sensitive currents. A, rerg1a (Aa) and rerg1b (Ab) currents elicited with 5 s depolarizing test pulses from a holding potential of −80 mV before and after application of TRH. The erg tail currents elicited upon repolarization to −100 mV are shown as insets on expanded time scale in Ca and b. B, mean (±s.e.m.) relative erg current amplitudes measured at the end of the depolarizing test pulses as indicated in A. Current amplitudes before (open symbols) and after (filled symbols) TRH application were normalized to the maximal control erg current amplitude. C, plots of the maximal erg current amplitude elicited with the constant hyperpolarizing pulse to −100 mV as a function of the preceding test pulse potential. Mean relative erg current amplitudes (means ±s.e.m.) are given before (open symbols) and after (filled symbols) TRH application, and the continuous lines represent Boltzmann functions fitted to the data points. In addition, the normalized activation curves after TRH application are shown to facilitate the comparison of their voltage dependence. D, comparison of the TRH-induced shift in the voltage dependence of erg current activation determined for the different erg1 currents. The mean V0.5 values before (C: bottom of the columns) and after TRH application (TRH: top of the columns) are derived from Boltzmann functions fitted to the data points of single experiments. Downward error bars starting from the bottom of the columns indicate –s.e.m. of the control values, upward error bars starting from the top of the columns indicate +s.e.m. of the values after TRH application. Numbers indicate the number of experiments.

