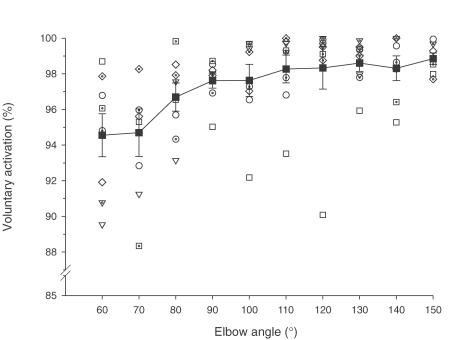
Figure 5. Voluntary activation of elbow flexors before exercise for individual subjects and the group.
Data for voluntary activation in MVCs for individual subjects obtained under control conditions are plotted across the angular range. Each open or dotted-open symbol shows data from an individual subject. Five of eight subjects had significantly lower voluntary activation at short lengths (see text). The mean for the group is also shown (filled squares with lines). At short lengths, voluntary activation was reduced for the group (P < 0.05).

