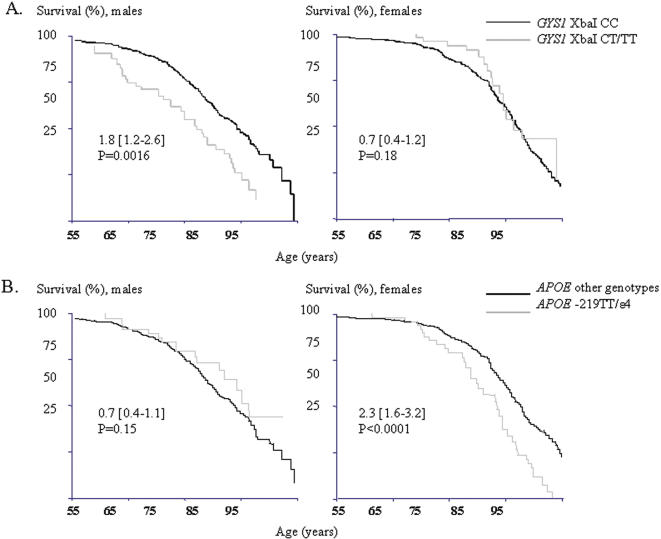
Figure 1. CV mortality in males and females according to the GYS1 XbaI (A) and APOE –219/ε2/ε3/ε4 (B) genotypes.
Kaplan Meier survival curves illustrating a higher risk for CV mortality (HR 1.8 [1.2–2.6], p = 0.0016, pc = 0.0096) in male carriers of the GYS1 XbaI CT/TT-genotypes and in female carriers of the APOE –219TT/ε4 genotype combination (HR 2.3 [1.6–3.2], p<0.0001, pc<0.0001).

