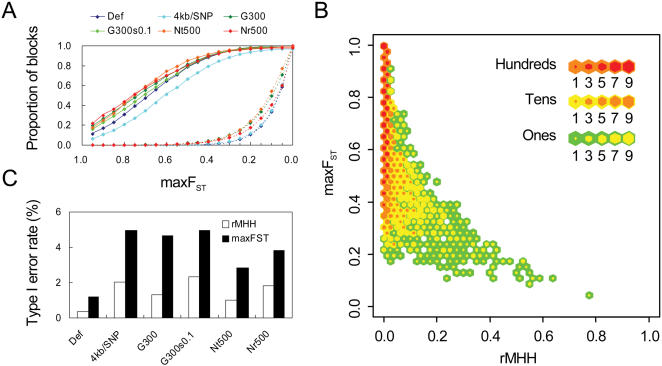
Figure 3.
Comparison between rMHH and maxFST. (A) Accumulative distribution of maxFST. (B) The distribution of rMHH and maxFST under a selection model (default settings as in Fig. 2). (C) Type I error rate of rMHH and maxFST at the threshold of 90% detection power under different models. The difference between rMHH and maxFST was significant (P<10−17 to 10−100).

