
Fig 3.
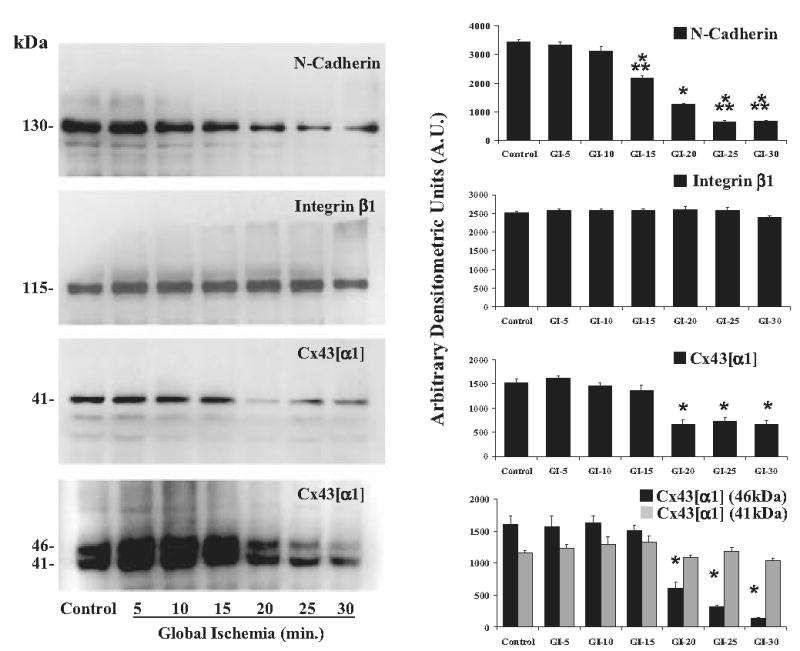
Western blot analysis. Representative Western blots for N-cadherin, integrin-β1, and Cx43[α1] and Cx43[α1] phosphorylated Cx43[α1] (46 kDa) and dephosphorylated Cx43[α1] (41 kDa). Molecular weights (kDa) for each band are shown. Densitometric analysis for n = 4 blots each is shown on the right. Results show a significant decrease in N-cadherin at 15 minutes of global ischemia (GI) and Cx43[α1] and phosphorylated Cx43[α1] (46kDa) at GI-20 (p < 0.0001 versus control). There were no significant changes in integrin-β1 All results are shown as mean ± SEM. Significant differences are shown as *p < 0.001 versus control, and **p < 0.001 versus GI-20.