
Fig. 3.
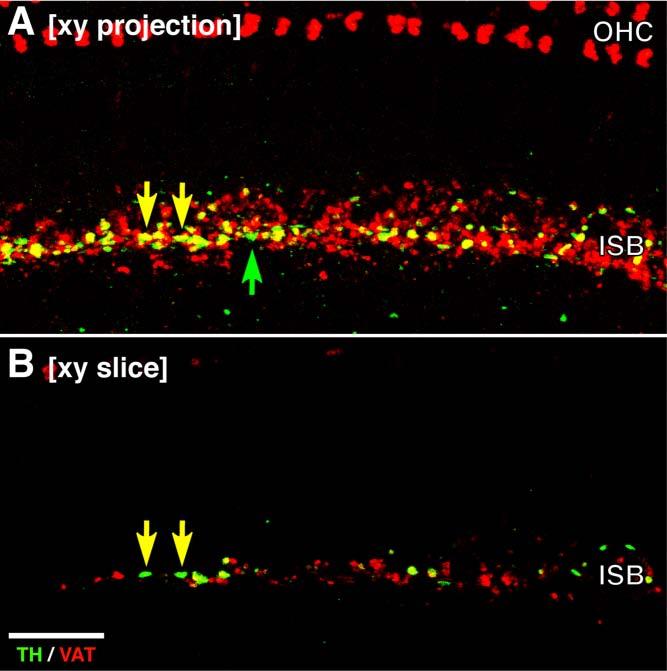
Comparison of xy projection (A) and a single slice (B) from a double-immunostained confocal z-series shows that apparent colocalization in the projection view (yellow arrows in A) often arises from superposition of signal from different focal levels and thus different terminals: the source of the green channel (TH) signal in A is shown by the arrows in B; at that focal level, there is no red (VAT signal). All images are from the same confocal z-stack (114 slices at 0.25 μm per slice) from the middle of the second turn. Scale bar = 20 μm.