
Figure 6.
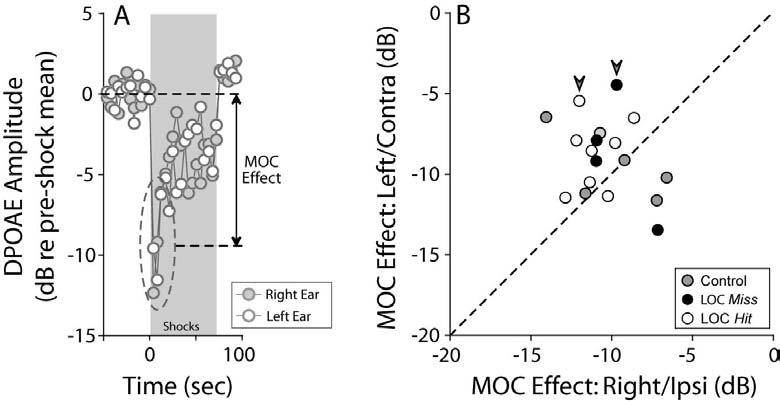
Bilateral suppression of DPOAEs, elicited via midline electrical stimulation of MOC fibers, suggests that MOC function is minimally affected by the lesions. A: One run of the MOC assay in a control case demonstrates symmetrical DPOAE suppression in right and left ears. “MOC effect” is defined as the dB difference between mean DPOAE amplitude in the first three measures after shock onset, compared to the pre-shock baseline. B: MOC effects in right and left ears of control, LOC Hit and LOC Miss cases. Large arrowheads indicate the cases with histological evidence of MOC lesions (Figures 3, 4, and 5D). For data shown, f2 was 22.6 kHz.