
Figure 2.
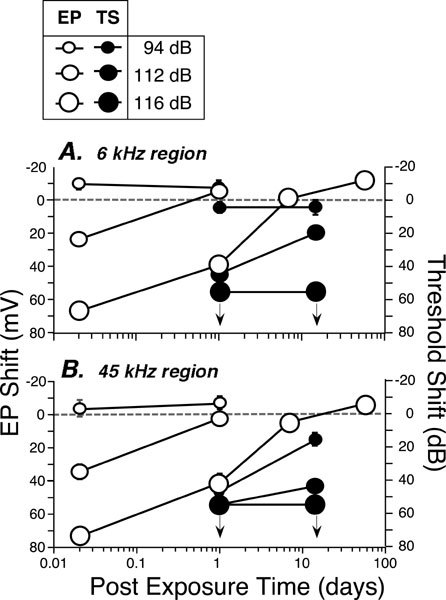
Endocochlear potential (EP) shift re: control means and ABR threshold shift (TS) re: control means plotted against postexposure time for measurements at two cochlear locations. A and B. EP measurements from the second turn and first turn, respectively, each compared with ABR threshold shifts at the test frequency appropriate for that cochlear location. Animals in each group were: Control: n = 13; 116 dB/0 h: n = 8; 116 dB/24 h: n = 13; 116 dB/7 days: n = 7; 116 dB/8 weeks: n = 7; 112 dB/0 h: n = 7; 112 dB/24 h: n = 7; 94 dB/0 h: n = 6; 94 dB/24 h: n = 6.