
Figure 3.
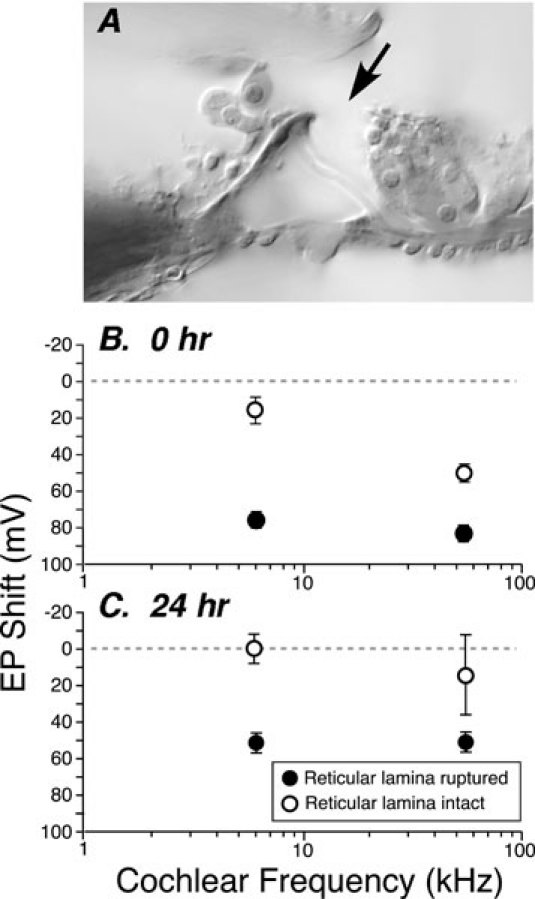
Endocochlear potential and reticular lamina integrity after exposure to 116 dB. A. Light micrograph showing the rupture of the reticular lamina (arrow) seen acutely in the tonotopic damage focus in many ears exposed at 116 dB. B and C. Mean EP (±SEM) plotted versus cochlear frequency with subjects divided into two groups: those with intact reticular lamina (RL) and those with RL rupture in the tonotopic focus. Numbers of subjects in each group were: 0 h w/RL rupture: n = 4, 0 h w/RL intact: n = 4; 24 h w/RL rupture: n = 4; 0 h w/RL intact: n = 3.