
Figure 9.
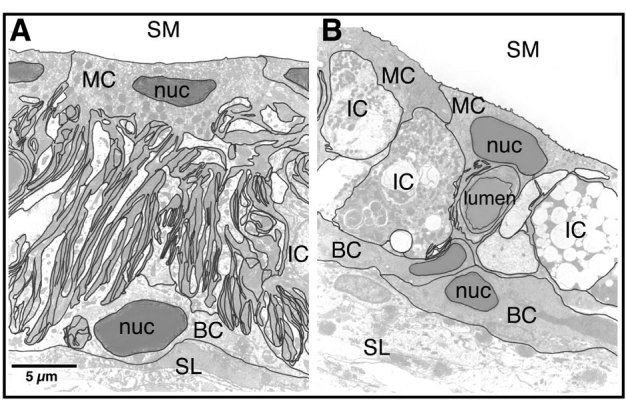
After 116 dB noise exposure, marginal and intermediate cells of the stria vascularis show extensive loss of membrane surface area. A and B. Tracings of all apposing membrane surfaces superimposed on electron micrographs from (A) a control stria and (B) a stria 4 weeks after 116 dB. Both micrographs are from the upper basal turn. Note that this example demonstrates a roughly 50% decrease in strial cross sectional area, whereas the mean reduction for this cochlear region was ~20% (Fig. 1C). SM = scala media; MC = marginal cell; IC = intermediate cell; BC = basal cell; nuc = nucleus; SL = spiral ligament; lumen = endothelial cell lumen. Scale bar applies to A and B.