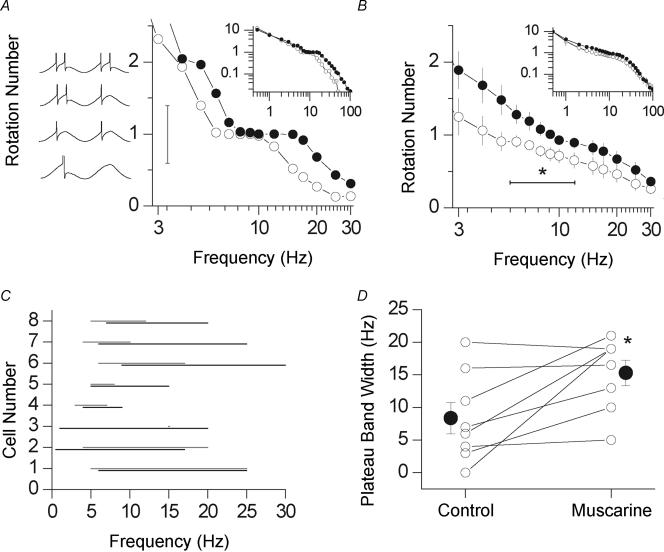
Figure 2. mAChR activation extends the frequency band of 1: 1 phase locking.
A, inset, in a representative cell, rotation number (average spikes per cycle; R#) gradually declines from 12.5 at 0.5 Hz to 0 at 100 Hz in control (○), and 10.7 at 0.5 Hz to 0.016 at 100 Hz after application of 10 μm muscarine (•). A, plot of R#versus frequency shows that the cell fires approximately every cycle (R#= 1) from 5 to 12 Hz in control (width = 7 Hz) and from 7 to 17 Hz after application of 10 μm muscarine (width = 10 Hz). B, inset, mAChR activation increases the average R# in the theta band from 0.79 ± 0.07 (open symbols) to 1.11 ± 0.08 (filled symbols; n = 9, P = 0.007). C, representative cells for frequency bands at which R# is 1 ± 0.4 (vertical grey bar in A) in control and 10 μm muscarine (black bars). D, averaging across cells shows this bandwidth is significantly wider after application of 10 μm muscarine (8.4 ± 2.4 versus 15.3 ± 2.0 Hz; P < 0.05).

