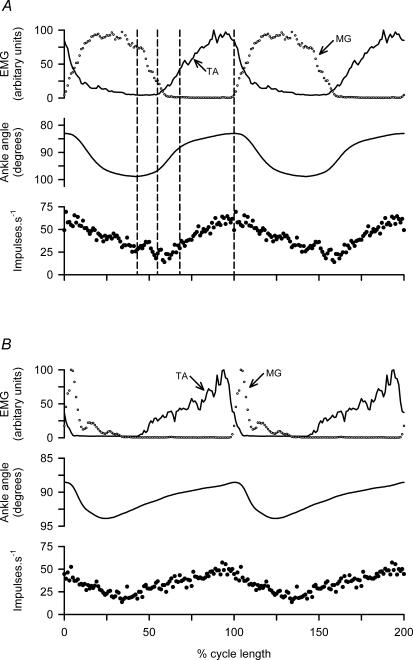
Figure 3. Ensemble cycle averages of γs firing.
A, data analysed from the three simultaneously recorded γs units of Fig. 2 and B, from three γs units in another experiment, also with spontaneous locomotion. In each panel the uppermost traces show averaged EMG from TA (continuous line) and MG (○), the middle trace shows ankle angle corresponding to TA shortening upward, and the lowest trace averaged instantaneous frequency of the three units. The cycles (20) were aligned for averaging on the TA minimum length point and normalized in time; 1.5 cycles of the average are plotted for clarity and the points are 100 cycle−1. Mean cycle times were A: 640 ms and B: 800 ms. The broken lines in panel A indicate the three phases of TA muscle shortening.

