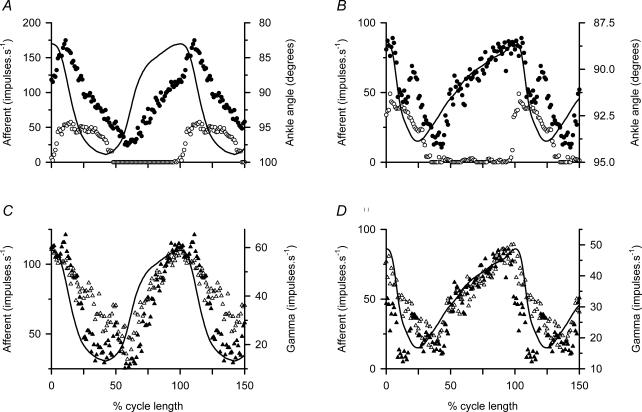
Figure 4. Comparison of spindle difference signal with γs firing.
A and C, cycle-averaged data from the experiment illustrated in Fig. 3A; B and D similarly from the experiment of Fig. 3B. All panels show ankle angle as a continous line with TA shortening upward. In A and B• indicates afferent frequency during active locomotor movements. ○, the equivalent during the passively repeated movements. C and D, the corresponding afferent difference signal (active response – passive response) as ▴ and the averaged γs firing as ▵. The afferents in A and C were ensemble averages of two b1b2c primaries, and in B and D they were ensemble averages of three b1b2c primaries. In each case the γs records were ensembles of three units.

