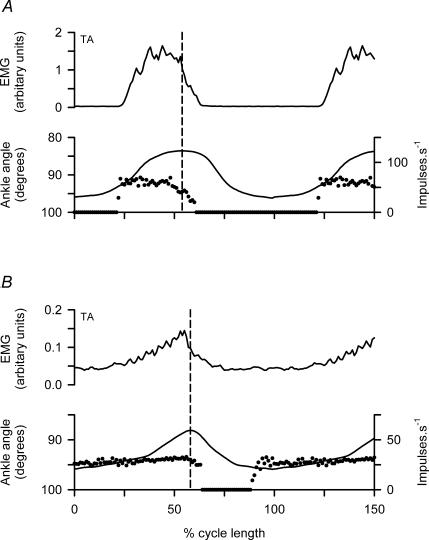
Figure 7. Cycle averages of TA γd related to EMG and active muscle shortening.
A and B, cycle averages from the data of Fig. 7A and B using 9 cycles and 12 cycles, respectively. Muscle length is indicated by internal ankle angle with shortening upwards. Cycles were aligned with the moment of maximal muscle length and were normalized to show 1.5 cycles (mean durations 740 and 735 ms). The broken lines indicate the start of muscle lengthening. Note the sudden onset of firing from a silent background, the relatively constant maintained frequency and the cessation of firing shortly after the start of lengthening.

