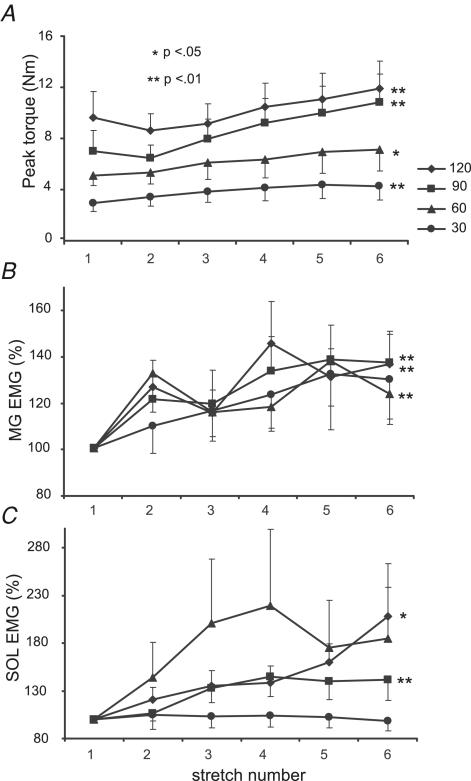
Figure 2. Mean torque and EMG responses to repeated stretch at 30–120 deg s−1.
A, means and s.e.m. of ankle torques in 14 subjects during 6 repeated stretches at 120, 90, 60 and 30 deg s−1. Significant increases in torque are shown at all velocities (P ≤ 0.01 for 120, 90 and 30 deg s−1 and P < 0.05 at 60 deg s−1). B, normalized medial gastrocnemius (MG) EMG for 13 subjects with significant differences at 120, 90 and 60 deg s−1, P < 0.01. C, normalized SOL EMG in 11 subjects with reliable recordings, with significance shown for 120 deg s−1, P < 0.05, and 90 deg s−1, P < 0.01. Peak torques declined immediately following the initial stretch but demonstrated gradual increases with additional stretches. In contrast, EMG activity gradually increased with repeated stretch.

