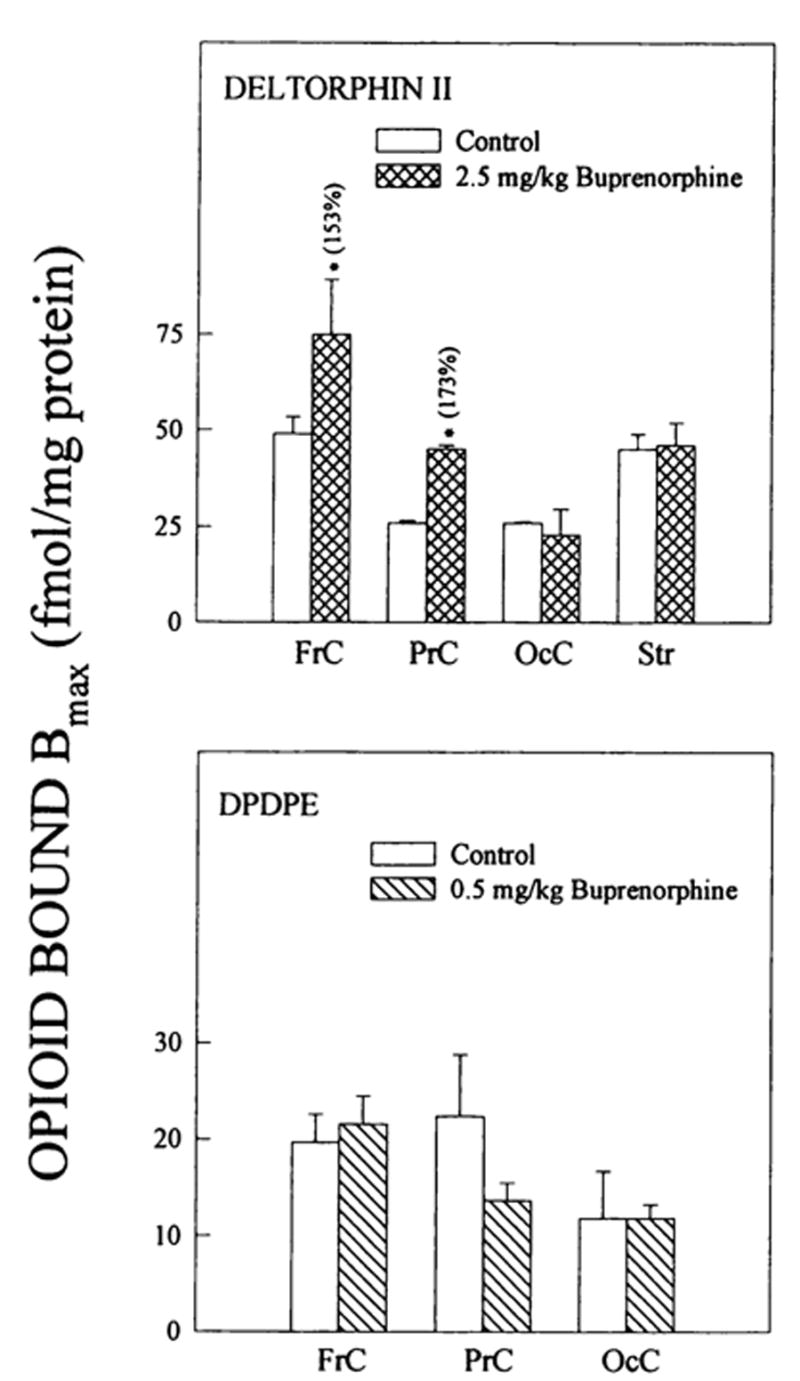
Fig. 3.

Changes in δ opioid binding to brain regions from buprenorphine-treated rats. δ1 binding was detected with DPDPE and δ2 densities with deltorphin II. Corresponding Kd values for deltorphin II ranged from: 1.0 ± 0.05–2.0 ± 0.1 (controls) and 1.0 ± 0.2–1.8 ± 0.3 nM (2.5 mg/kg buprenorphine) and for DPDPE: 1.9 ± 0.6–3.3 ± 1.4 (controls) and 1.6 ± 0.2–2.5 ± 0.6 nM (0.5 mg/kg buprenorphine). Numbers in parentheses represent binding as % of controls, *vs. controls, P < .05. Data are the mean ± S.E.M. of three to five experiments.
