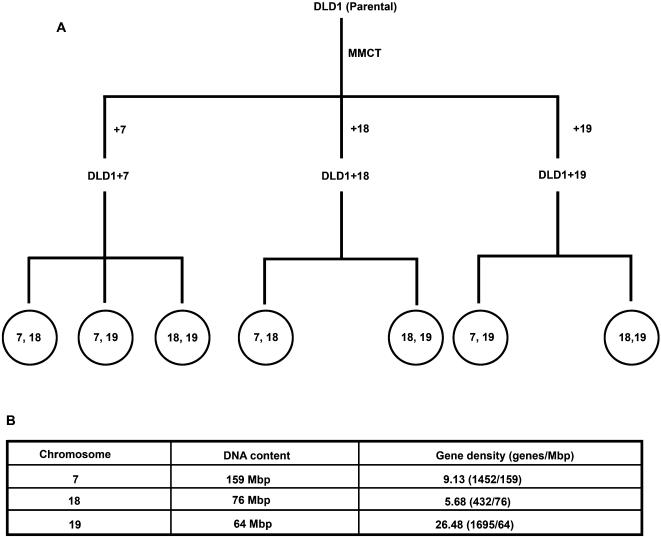
Figure 1.
A: Schematic representation of the experimental design. DLD-1 (parental cell line) was subjected to MMCT to generated derivative cell lines DLD-1+7, DLD-1+18 and DLD-1+19. 3D-FISH was performed on each of the derivative cell lines with the probe combinations indicated. B: Table showing comparisons of DNA content and gene density between Chromosome 7, 18 and 19.

