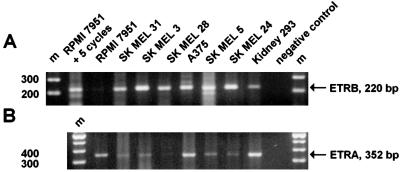
Figure 3.
Reverse transcription–PCR reveals the expression of ETRB and ETRA mRNA in all cell lines used. Bands corresponding to ETRB (A) (220 bp) and ETRA (B) (352 bp) mRNAs were obtained by using published primer sequences and protocols (18). For the cell line RPMI 7951, an additional five PCR cycles were needed to obtain a strong band for the ETRB shown in A. Molecular weight markers (m) are shown in the outer lanes of the gel near the negative controls, in which the cDNA was omitted.

