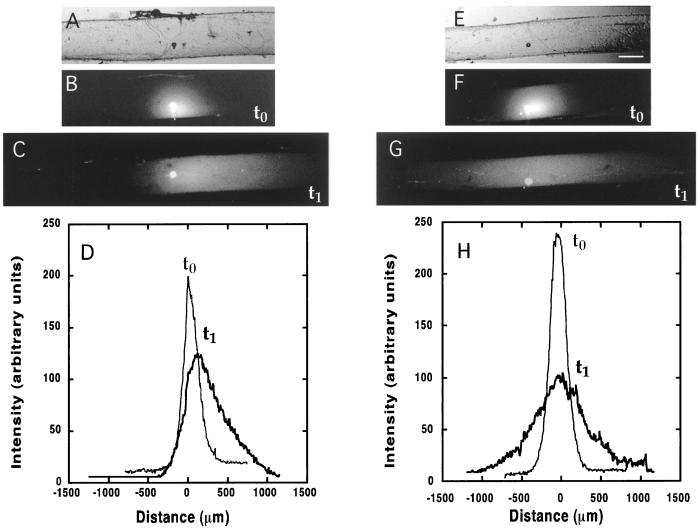
Figure 2.
Active transport and diffusion of fluorescently labeled tubulin proteins. Note that tubulin diffused much more extensively than the neurofilament shown in Fig. 1. The images are arranged as in Fig. 1: A and E, bright-field; B and F, fluorescent image soon after injection; C and G, 3 hr later; and D and H, trace of fluorescence intensity. (The scale bar in E is 250 μm for all images; length scales of the intensity traces are the same as Fig. 1.)

